Making the chart is the easy part: select two columns, pick a chart type,
done. When it goes wrong, and with CSV files it often does, the chart is
almost never the problem. The data is. A number stored as text, one N/A in
a column of figures, a year column the tool decides is a data series. Fix
those and any tool will draw the chart.
The fast answer
- Excel: open the CSV, select the label column and the number column, Insert → Recommended Charts.
- Google Sheets: upload, open, select, Insert → Chart.
- Python:
pandasplusdf.plot(), three lines, below. - On a phone: an app that charts a CSV directly, without converting it to a spreadsheet first.
- Before any of them: check that the number column really is numbers, and decide whether you need to total the data first.
Step zero: does this data need summarising first?
A CSV export is usually one row per event: per order, per transaction, per visit. Charting that directly gives you 40,000 thin bars. What you actually want is one bar per category: revenue per month, orders per region.
So first ask: one row per what? If the answer isn't the thing on your chart's x-axis, total it first. In Excel or Sheets that's a pivot table. With SQL it's one query:
duckdb -c "SELECT region, sum(amount) AS revenue FROM 'orders.csv' GROUP BY region ORDER BY revenue DESC"
Then chart the small result, not the big file. The guide to totalling a column in a CSV covers this step in more detail.
Pick the chart from the question
| You want to show | Use | Avoid |
|---|---|---|
| Which category is biggest | Bar (horizontal if labels are long) | Pie with more than five slices |
| Change over time | Line | Bar, once you have more than ~20 points |
| Share of a whole | Stacked bar, or pie for 2–5 parts | 3D anything |
| Relationship between two numbers | Scatter | Line (it implies an order) |
| Distribution of one number | Histogram | Bar chart of raw values |
In Excel
- Open the CSV. (If it contains IDs, postcodes or long numbers, import it instead; see how to stop Excel changing your CSV data.)
- Select the label column, then hold Ctrl (⌘ on Mac) and select the number column.
- Insert → Recommended Charts, or pick a type directly.
The classic problem: the year column becomes a series. If your labels are
numbers (2021, 2022, 2023), Excel treats them as data and plots them as
a second line along the bottom. Either convert the label column to text, or
delete the header text in that column's first cell. With an empty top-left
cell, Excel reads the column as labels.
The other classic problem: nothing plots. Numbers stored as text (a green triangle in the corner of each cell) chart as zero. Select the column, click the warning icon, and choose Convert to Number.
In Google Sheets
- Upload the CSV to Drive and open it with Sheets, or File → Import into an existing sheet.
- Select the columns and choose Insert → Chart.
- In the chart editor, check Use column A as labels and, if the chart looks transposed, Switch rows / columns.
Sheets has one feature Excel makes harder: in the chart editor's Setup tab, ticking Aggregate next to the x-axis totals repeated labels for you. For a quick "sum per category" from raw rows, that saves the pivot table.
In Python
For anything you'll make more than once, a script beats clicking:
import pandas as pd
import matplotlib.pyplot as plt

df = pd.read_csv("orders.csv")
df.groupby("region")["amount"].sum().sort_values().plot(kind="barh")
plt.tight_layout()
plt.savefig("revenue-by-region.png", dpi=200)
Run it again next month on the new export and the chart updates itself.
The data problems behind most broken charts
- A column with one non-number in it.
N/A,-,TBCor a blank typed as a space. Many tools then treat the whole column as text, and it either vanishes from the chart or plots as zero. - Currency and thousands separators.
$1,200is text to most parsers. Strip symbols and separators, or use a tool that understands them. - Decimal commas. A file from a German or French system writes
1.234,50. Opened in an English locale, that's text, or worse, a number a thousand times too large. - Dates as text. Sorted alphabetically,
Aprcomes beforeJan. Convert to real dates, or name months2026-01,2026-02, which sort correctly even as text. - A total row at the bottom. Many exports end with a "Total" line, which then towers over every real bar. Delete it before charting.
On a phone
The phone spreadsheet apps can chart a CSV after converting it, with the same data problems as above and a smaller screen to fix them on. A CSV app that charts the file directly skips the conversion.
In Smart CSV Viewer it's ⋯ → Chart: pick a type, choose the Labels column and one or more Series columns, and export the chart as an image. If a series column holds anything that isn't a number, it tells you which column and which cell, and a tap takes you to that cell to fix it, which is the fix for the first problem in the list above.
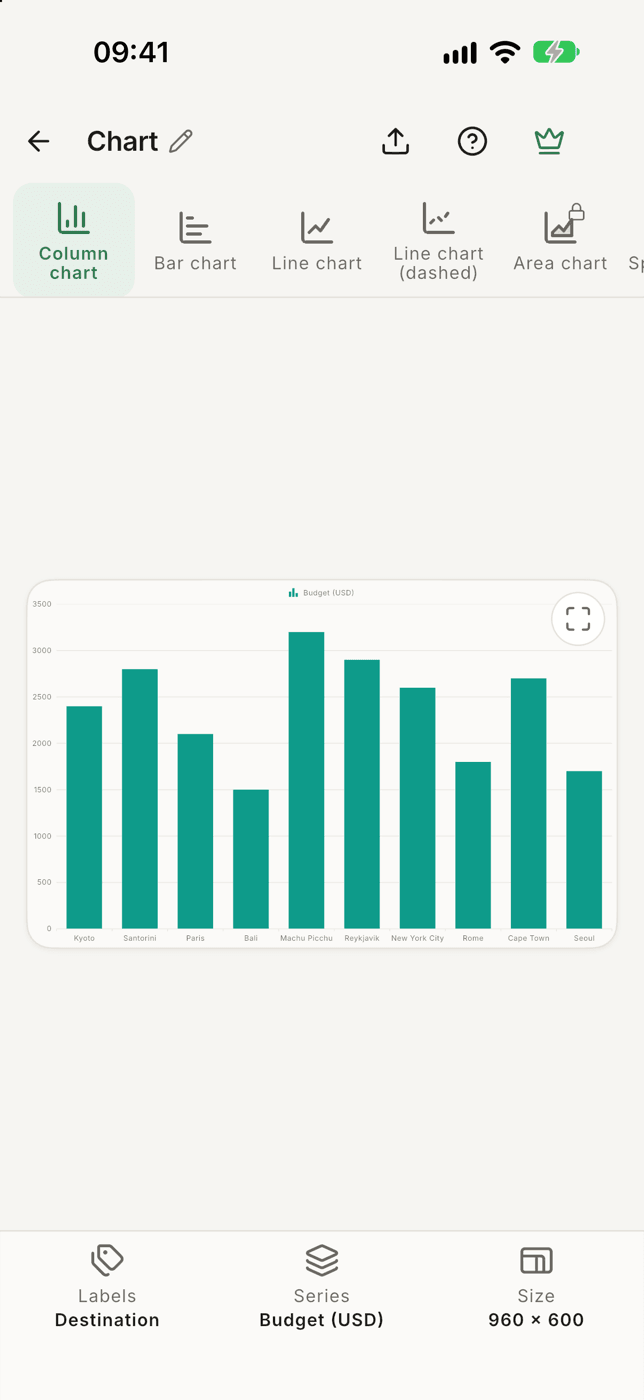

Charts a CSV on iPhone or Android without converting it, names the cell that isn't a number, and exports the chart as an image.
What it doesTo be upfront about the limits: the free version draws column, bar and line charts from the first ten rows; Pro adds every chart type and up to 1,000 rows. For a chart of a big raw file, summarise it first, as in step zero. That's good advice at any price.